Algo
N/AMarch 07, 2022
Mindsparkle Mag


What's the Air Quality like in New York today?
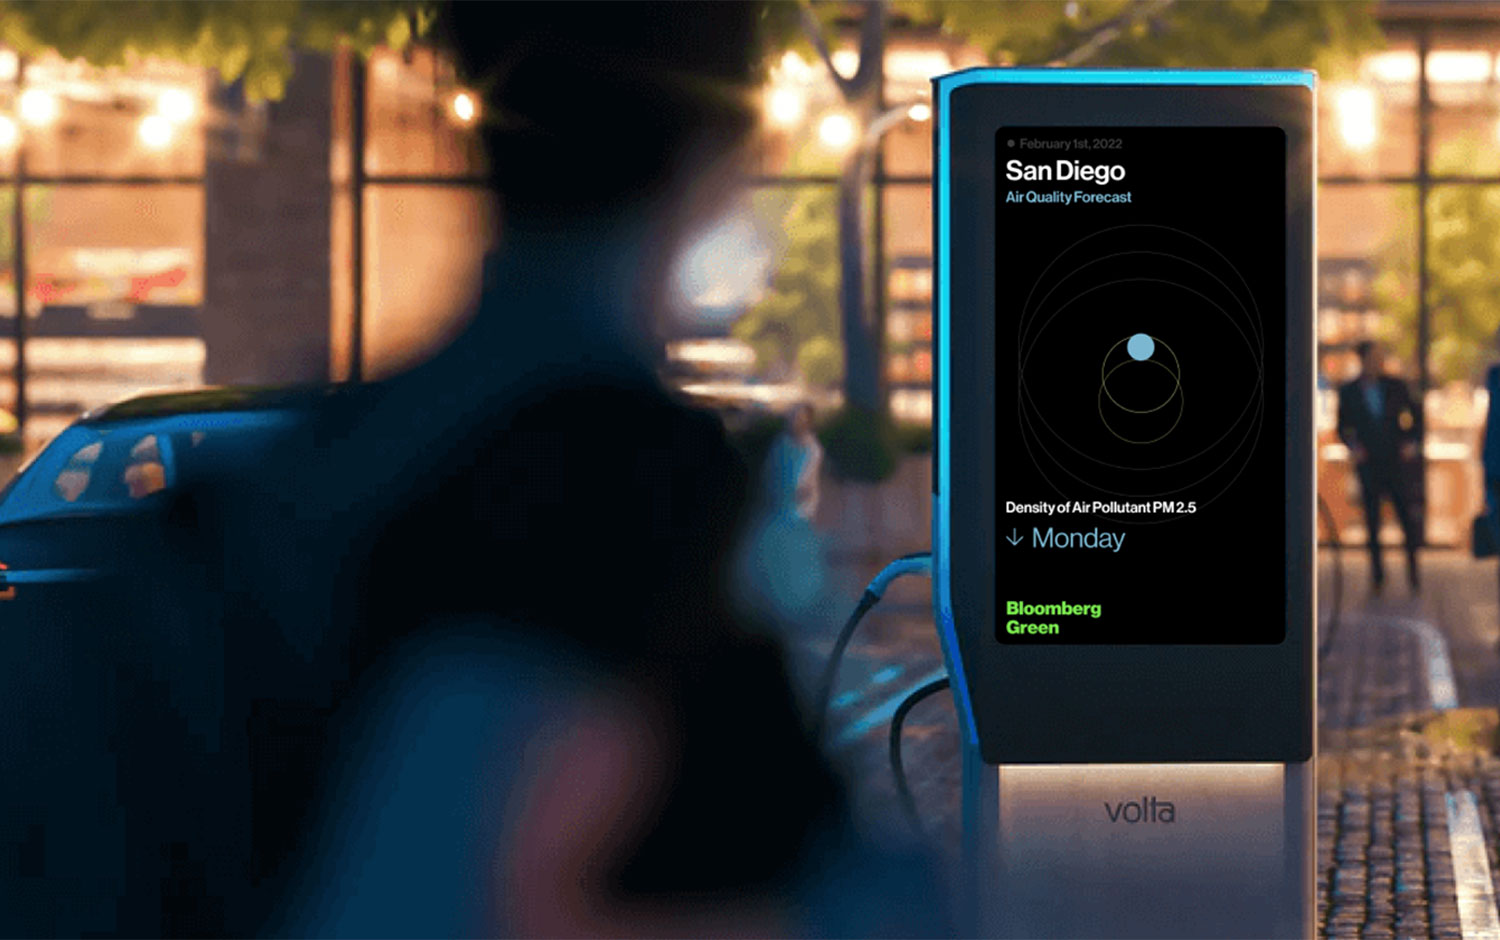
You can look that upon any of the Volta electric charging station billboards. Algo turns the Bloomberg Green data into an outdoor video experience – available in the 12 major cities across the US.
In partnership with Bloomberg Green, the Algo team designed and developed a short-form data visualization displayed in each city on the billboards of the Volta electric charging stations. The daily videos show the evolution of the Air Quality of the last four days in 12 major American cities.
Since the videos are short and displayed outdoor –imagine people passing by in a rush– they made sure that data could be visualized clearly and digested quickly. That’s why, instead of relying on a textual representation of pollution values, they decided to turn them into shapes and colors, something much more understandable visually. The circle representing PM 2.5 enlarges, and its color warmer if pollution is high. Contrary, if the numbers are looking good it shrinks with colder shades. Plus, by keeping a light trail of the previous circles, the most attentive viewers can visualize the evolution of the air quality throughout the week. Thanks to the integration with Volta’s Ad Servers, videos are automatically pushed to their content delivery network for a smooth, human-free distribution on their digital billboards across the US.
The 8-seconds-long Air Quality forecast gets inserted into the carousel of ads, interrupting the advertisements to showcase more relevant, real-time data for citizenship. This way, the right video reaches the right screen, effectively linking the function (charging your electric vehicle) with the goal of living in a city with clearer air. A breath of fresh air for Volta.
Creator: Algo